Class-Based QoS Usage
Class-Based QoS Usage report reveals class-based quality of service (CBQoS) metrics within your network, where "class" denotes a traffic stream that can be identified by different criteria such as interface, port, and so on. This report indicates the effectiveness of class-based policies applied for specific traffic classes, which are used to prioritize and shape network traffic patterns. Note that class-based policies can be applied to specific interfaces and traffic direction.
Class-Based QoS Usage chart data reflect the following:
- QoS Class Map. Displays the QoS class name as defined by the policy assigned to the interface.
- Pre-Policy. Displays the amount of traffic for the class before the policy is applied (for the selected date range).
- Post-Policy. Displays the amount of traffic for the class after the policy is applied (for the selected date range).
- Dropped. Displays the number of bytes dropped as a result of applying the policy to the class (for the selected date range).
- . Traffic class.
- . Policy applied.
- Policy rules.
- . Flow source.
- . Network interface.
- . Traffic direction across the interface (In/Out). Bounced traffic is not considered.
- . Pre-policy bandwidth.
- . Pre-policy observed rate.
- . Post-policy bandwidth.
- . Post policy observed rate.
- . Dropped volume.
- . Rate observed where traffic was dropped.
: You must have defined QoS classes and policies on the source device before this report is able to display results.
: The CBQoS information generated by the source device must be gathered using SNMP polling for CBQoS information.
Generate a report
.  ,
,  Choose a networking device or single physical or virtual interface you want to see Class-Based QoS Usage measurements for. Choose traffic direction across an interface.
Use the Select Device dialog for one of the following:
Control
|
Description
|
Device.
|
Browse and choose a networking device that is a Network Traffic Analyzer monitoring source. (For example, wireless router, router, and more)
|
Network Interface.
|
- Choose a single physical or virtual interface Network Traffic Analyzer you want traffic statistics for.
- Choose direction of traffic over the network interface (, , , or for invalid traffic.).
|
Network. 
|
Network devices known to NTA.
|
.  Choose times for the Class-Based QoS Usage. (Subject to NTA collection interval and retention policies.)
Choose time constraints for your NTA data view
Date Range . Choose or define an overall window of time network activity data.
: Detail rendered in graphs depends on the time window you choose (Date Range) along with how long your system retains raw, hourly, and daily time-series data (NTA data collection and Data Retention settings). NTA graphs network activity as time-series averaged over daily intervals, hourly intervals, or over shorter periods (raw). Raw data interval is defined by the Data Collection interval value in NTA settings.
: If you choose a time window outside of your NTA default data retention limits (47 hours for Raw and 19 days for Hourly, for example) your graph will default to an interval detail of Daily.
Detail Revealed with Default Retention Settings
Over time, the NTA collector cleans up older data. Eventually, collected data is combined into daily totals at the rates shown in the following table. If your site's mission and database capacity allow for more detailed data be retained for longer periods, increase the default retention settings for in the NTA Settings dialog ( menu ).
Report Time Window Selection
|
Data Interval Shown in Graph (default retention settings)
|
Example
|
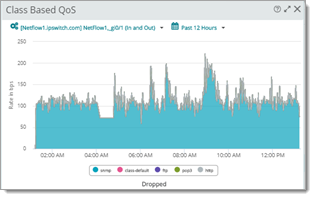
0 – 47 hours
|
Raw
- Data interval = every two minutes.
- Default data retention = two days up to now. In other words, 47 hours plus the current fraction of the ongoing hour (unless extended in NTA Settings - Interface Data).
|
Class Based Quality of Service past 12 hours (raw detail dropped packets)
|
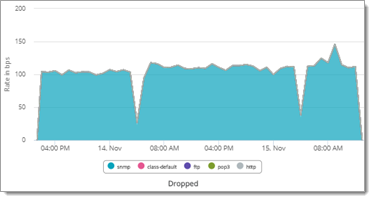
past 48 hours within the past 19 days
|
Hourly
- Data interval = every hour.
- Default data retention = 19 days plus the current fraction of a day (unless extended in NTA Settings - Interface Data).
|
Class Based Quality of Service last two days (hourly dropped packets)
|
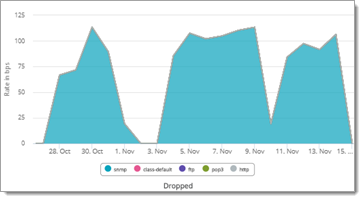
20 days or more
|
Daily
Data interval = every 24 hours.
Daily is also the Archive data interval.
|
Class Based Quality of Service over the last 20 days (daily dropped packets)
|
.  Choose, hide, and reorder columns to customize your data view.
Filter and pick by column
Click a report heading () and use the "column picker" ( ) from the drop down list.
Control
|
Purpose
|
Columns.
|
Click a check box to display the column. Clear the check box to hide it.
|
Move Column.
|
Click on a column heading and drag it to reorder your table's columns.
|
Advanced Filtering. 
|
Apply category, pattern, and keyword filtering to column data.
|
: The totals for this report are gathered by direct polling selected interfaces running on the target device. Advanced Filters can be applied only for reports generated from flow summary data.
.  Fine tune report presentation and range of values displayed using the Report Settings dialog (optional).
Specify threshold and top n:
Control
|
Purpose
|
Show Top n Items
|
Limit items to the samples with the highest (or lowest) interface errors.
|
Threshold Type
|
Switch between minimum or maximum mode for cutoff values for the ranked list.
- At or Over. Show peak occurrence period. (Observations equal to or greater than Threshold.)
- At or Under. Show occurrences equal to or less than Threshold.
|
Threshold (percent)
|
Baseline value used to trim ranked device list based on peak or subpeak periods when returning the Top n.
|
Chart and visualize data over time (single device  )
)
Charting and visualization is available when you select a single device.
Control
|
Purpose
|
Display Options
|
Present data as a chart, a table grid, or both.
|
Chart Type
|
- Gauge charts. Available when you select a Date Range of .
- Time series. Available when you select a Date Range interval (, for example).
- Line/Area. Scatter graph that connects adjacent measurements with straight lines.
- Spline/Area Spline. Choose a graph with a smoothed appearance where adjacent samples exhibit a gradual slope.
|
Chart Options
|
- Legend, Grid Lines, Range Selector. Include legend, grid lines, and range selector for readability.
- Trend Lines. Present data with a smoothed average to show trend.
- Vertical Axis Scale. Automatically scale to fit data or specify a finite range.
|
: Trend lines represent a moving average that can be compared with line and area graphs to reveal peak and sub peak intervals, collision periods, and indicate transmission problems.
Share, export, and save as PDF
Most generated Class-Based QoS Usage report data can be printed, shared, and exported when selecting ( ) from the Dashboard Options (
 ) menu. After the report has been expanded, select export (
 ) to access the following options:
 Choose source.