Network Traffic Analysis![]() Listener Port, Collection, and Retention Settings
Listener Port, Collection, and Retention Settings
Network Traffic Analysis![]() Listener Port, Collection, and Retention Settings
Listener Port, Collection, and Retention Settings
NTA Settings dialog (SETTINGS > Network Traffic Analysis > NTA Settings) provides NTA system and application settings such as level of detail and severity for log messages, the port(s) NTA listens on along with collection interval, retention, and data management properties. To automatically check if you are approaching limits for NTA data volume settings, you can create alerts with the WhatsUpHealth Threshold and periodic reports such as Archive Database Size and Database Table Usage.
NTA Listener and Collection Settings
NTA Settings Dialog (Listener and Log Settings panel shown)
|
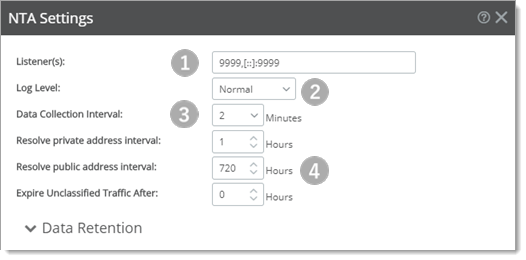
Listener(s). Specify the TCP/IP port number, IP address, or both IP address and ports on which the Network Traffic Analysis collector service should listen to receive flow packets, or leave blank to keep the default setting. Network Traffic Analysis can listen on one or more ports/IP addresses.
Tip: Flow exporters running on source devices from different vendors (HP, Cisco, Extreme Network, and so on) will use different destination ports for NetFlow packets (2055, 9995, and 9996, for example).
Note: If you configure Network Traffic Analysis to listen on a port other than default port, verify the port is not being used by another service. Additionally, if you are using Windows Firewall, ensure that an exception is added to the firewall. Note: More than one endpoint may be configured. Enter multiple endpoints using a comma-separated list. Example: |
|
Log level. Select the log level details. Each level includes higher levels of severity. Verbose includes Normal and Error, for example.
|
|
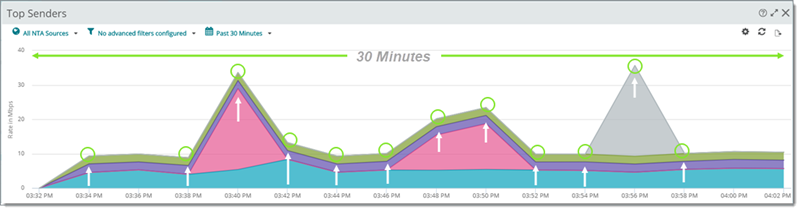
Data collection interval. How often NTA data is saved to its database. Select how often Network Traffic Analysis writes raw flow data from its sources to the database. You may select 1, 2, 3, 4, 5, or 10 minutes. By default, raw data is written to the database every 2 minutes. Important: Modifying Data Collection Interval settings affects the graphical detail (how raw flow measurements are grouped by interval and plotted) and affects precision with respect to time in the Network Traffic Analysis reports. For example, if the interval is set to five minutes, you cannot distinguish a traffic spike collected during the first minute from traffic collected during the fourth minute. Data Collection Interval of Two Minutes Revealed by Past 30 Minutes Graph (Peak and Low Events Identified with Arrows)
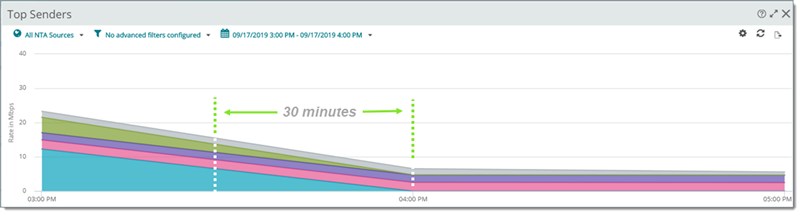
Hourly Intervals Seen for the Same Period (Hourly Trends Revealed and Minute-by-Minute Trends Masked)
|
|
Resolve private address interval. When the Network Traffic Analysis collector service encounters an IP address, it tries to determine information about the host attached to the IP address. After this information is resolved, it is stored in the Network Traffic Analysis database. Enter the interval (in hours) that you want Network Traffic Analysis to wait, before it checks the private IP address again, to resolve information that may have changed for the address. By default, private addresses are resolved every 48 hours. Resolve public address interval. When the Network Traffic Analysis collector service encounters an IP address, it tries to determine information about the host attached to the IP address. After this information is resolved, it is stored in the Network Traffic Analysis database. Enter the interval (in hours) that you want Network Traffic Analysis to wait, before it checks the public IP address again, to resolve information that may have changed on the address. By default, public addresses are resolved every 720 hours (30 days). Tip: Because public IP addresses are less likely to be changed, you may want to use longer intervals than used for the Resolve private address interval option. Expire unclassified traffic after. Enter the number of hours after which Network Traffic Analysis should purge unclassified traffic. Unclassified traffic is traffic transmitted over ports that are currently not monitored by Network Traffic Analysis. By default, this option is set to 1, which causes Network Traffic Analysis to aggregate and retain data for all unclassified ports as a single value; detailed information about the individual unclassified ports over which traffic was transmitted is discarded. Important: Be cautious about increasing the time for Expire Unclassified Traffic After value because the Network Traffic Analysis database can grow very large as the time is increased. Note: The collector will purge any unclassified data that has no activity after the Expire Unclassified Traffic After threshold value is satisfied.
|
Data Retention (with data cleaning and tuning)
You can use the data retention section of the Flow Monitor Settings dialog to set data retention parameters for observed traffic flow and interface data. Periodic pruning and archiving of received flow data minimizes system resources needed for data handling and storage and can improve system response during data intensive operations.
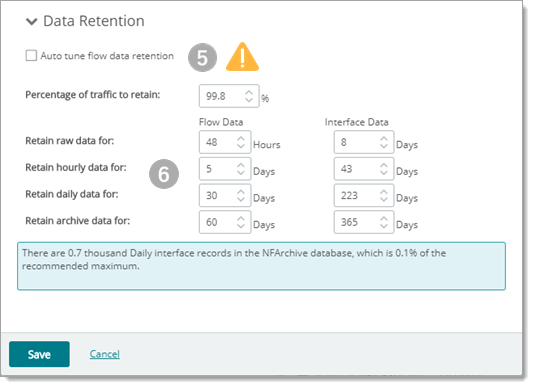
Caution: When enabled, the Percentage of traffic to retain control is sensitive! If you switch auto tune off, understand that even a tenth or a few hundredths of a percent increase in flow data on a busy network can result in enormous expansion of your database. Using auto tune is best practice.
NTA Settings Dialog (Data Retention panel shown)
|
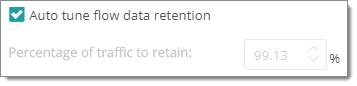
You can either manually tune data retention or allow Network Traffic Analysis to self-tune and optimize retention of flow data. Tuning is necessary to manage the growth rate of the Network Traffic Analysis databases. Auto Tuning Enables Automatic Cleanup of Flow Data
Tip: It is best practice to keep NTA Auto Tune for Flow Data Retention enabled. Auto Tune allows for empty or insignificant data to be scrubbed before it is added. Scrubbing incoming data where needed can be helpful for performance with no noticeable loss in fidelity. Flow data includes many parameters (input and output interfaces, source and destination IP addresses, port numbers, byte rates, flow end times, and so on) which provide useful information at the price of storage. Rolling up the data makes for efficient storage, but there may be losses of time-related information within individual flows. The following parameters are used to control the cleanup of flow data.
Percentage of traffic to retain. (Manual mode, not best practice, very sensitive) You must clear the Auto tune flow data retention checkbox to access this setting. Use this option to determine the percentage of raw traffic data the collector will write to the database. Your database can fill up very quickly if you misuse this control. You can view NTA Database size with the Database Table Usage and Archive Database Size reports and you can track size trends using the WhatsUp Health Threshold. Caution: Take care you have space and I/O performance before you increase these settings. While the default settings for data cleanup are conservative, when you modify the roll-up settings it can directly affect the size of the Network Traffic Analysis databases and the performance of the application. Monitor the effects of these changes to these settings on Network Traffic Analysis collector database size and application performance.
|
|
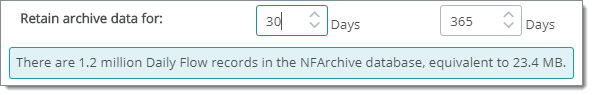
Note: When you place the cursor in a box to change a value, a message appears at the bottom of the dialog. This message provides information about the number and percentage of the recommended maximum flow records being stored in the Network Traffic Analysis data and archive databases. As you make changes, the message predicts how the change affects the number of records stored in the Network Traffic Analysis data and archive databases. Click on a Retention Period for Current Totals (daily NetFlow Archive data shown)
Retain raw data for. (Default value = 4 hours) Specify the minimum number of hours to retain flow packet data or keep the default value. At the end of the period, raw flow data is deleted, but you will still be able to access data rolled up into hourly and eventually daily totals. The rolling together of raw data measurements happens as soon as this data arrives. However, report graphs are not meaningful unless you use a timespan that is greater than the Data Collection Interval. Retain hourly data for. (Default value = 4 days) Specify the number of days you would like to maintain hourly data or keep the default value. As hourly data ages beyond this period it is rolled up. The roll up of hourly data takes place daily. Retain daily data for. (Default value = 15 days) Specify the minimum number of days to maintain daily data before archiving it or keep the default value. As daily data ages beyond this period, it is archived. Network Traffic Analysis continues to have visibility into archived data with some restrictions. This data is rolled into the archive daily. Retain archive data for. Specify the minimum number of days of archived data to maintain or keep the default value (Default = 40 days). This setting establishes a sliding time window of archived daily data that spans the specified number of days. After archived data extends beyond the period specified, it is purged from the flow collector database. Network Traffic Analysis can no longer report on data once it is purged. |
Before you change these settings from the defaults, consider possible reasons for persisting this data:
Data |
Use/Description |
Helpful for |
Raw Data |
|
Raw data is the basis of the Flow and necessary for all other time intervals. Persisting a table of raw data, captured in short (for example, two-minute) intervals, is also helpful for:
|
Hourly |
|
|
Daily |
|
Viewing long term (weekly, monthly, and quarterly) trends. |
Archive |
|
Viewing long term (weekly, monthly, and quarterly) trends. |