Network Traffic Analysis![]() Before You Begin
Before You Begin![]() What is Flow Data?
What is Flow Data?
Network Traffic Analysis![]() Before You Begin
Before You Begin![]() What is Flow Data?
What is Flow Data?
As network traffic data is observed at observation points, it can be captured as flow data, and delivered by network monitoring protocols. When a router or other device sends network traffic (flow) data to Network Traffic Analysis, it follows the sequence demonstrated in the illustration.
Note: The flow exporter can be either an included function of the network device, such as the NetFlow export functionality on Cisco routers, or an external probe configured to monitor one or more interfaces on the device, such as the NTA NetFlow Probe.
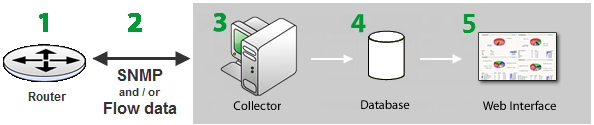
1 |
Flow Source |
The flow source device (shown in the illustration as a router) observes pass-through traffic and summarizes data characteristics into a NetFlow, NetFlow-Lite, sFlow, J-Flow (sampled NetFlow) or an IP Flow Information Export (IPFIX) export datagram. |
2 |
Flow Data |
Flow packets are sent in the form of an export datagram sent to a Network Traffic Analysis collector running on the WhatsUp Gold system. |
3 |
Collector |
The Network Traffic Analysis collector stores the NetFlow, NetFlow-Lite, sFlow, J-Flow (sampled NetFlow) or IP Flow Information Export (IPFIX) export in the Network Traffic Analysis database. By default, the NTA host (essentially, the WhatsUp Gold central host) expects to receive packets on port 9999. If needed you can change this from NTA Settings. |
4 |
Database |
NTA and flow data are archived in a database running on the WhatsUp Gold system. |
5 |
Web UI |
WhatsUp Gold enables you to view, share, apply user-based access controls, and analyze interactive dashboards and reports for network operations, forensic analysis, capacity planning, and much more. |
Note: sFlow data is sent every x number of packets (configurable on the sFlow device), whereas all NetFlow data is collected and monitored. This means that sFlow data provides a sampling of network traffic data characteristics, whereas NetFlow data provides all network traffic data.
Network Traffic Analysis uses the flow caching/exporter enabled on your source device (a properly configured interface, switch, or gateway) to get a summary of traffic seen over time. These traffic summaries are called flow packets.
SNMP or flow caching/export must be enabled at the potential flow export devices (network switches and interfaces, for example). The Network Traffic Analysis flow collectors identify potential flow export devices on your network (also referred to herein as flow "source devices") and automatically begin gathering their flow packets. You can elect to stop and later restart Network Traffic Analysis monitoring on selected source devices using controls provided in the NTA Sources Library.
A network flow is a unidirectional sequence of packets observed traveling through a flow caching and export device (referred to throughout this guide as an NTA source), which is intended for a destination device. In other words, a single TCP connection between two hosts can only be represented by two different flows.
Flow monitor data depends
Network Traffic Analysis complements other forms of WhatsUp Gold monitoring because it is less invasive and returns network data independent of the availability of both the sender or receiver device. In other words, even if a particular destination device is down or not responding to WhatsUp Gold active monitors, you can use Network Traffic Analysis monitoring to generate reports and dashboards that provide check points from each network hop (upstream or downstream network devices, for example) that support flow packet export.
With Network Traffic Analysis, WhatsUp Gold can return a history of critical availability, usage metrics, and indicators for entire segments and sections of your network. Network Traffic Analysis enables you analyze and attribute root cause when the unexpected happens on your network. Examples might be broken or misconfigured devices degrading QoS, causing congestion, disrupting service availability, and much more.
You can leverage Network Traffic Analysis logs, data, and dashboards in order to:
Tip: Network Traffic Analysis can collect and generate reports for Flow data from multiple devices.