![]()
![]()
![]()
![]()
|
|
|
|
|
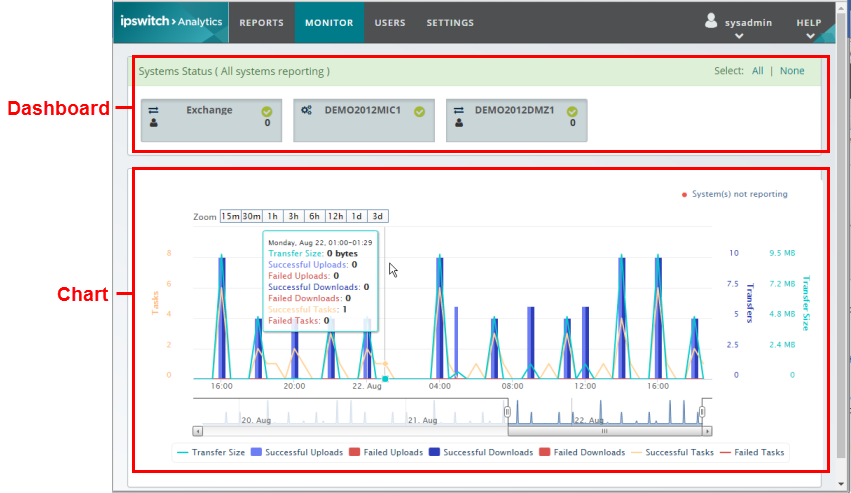
The Monitor is a chart that shows a high-level summary activity on your MOVEit server(s) for the past 72 hours, updating every 60 seconds to refresh with new data. Charted performance metrics include successful and failed uploads, downloads, tasks, and transfer size. A dashboard also shows the reporting status of all of Ipswitch Analytics Agents that collect data from your MOVEit database(s). Use the Monitor to track current server usage and status, detect short-term transfer and processing trends, discover and manage system issues as they arise, diagnose system health, and isolate failures. The Monitor shows you timely and actionable information for real-time response to system issues, so you can focus quickly on trouble spots to catch and respond to problems before they get out of hand.
Tip: Display the Monitor on a large screen where it can be seen by many people. The Monitor will continue to refresh graph data every minute until you choose to sign out.
The Monitor includes a dashboard where you can see the status of each Agent that collects data from a MOVEit database, and a chart below it that graphs that data:
For more information, see :