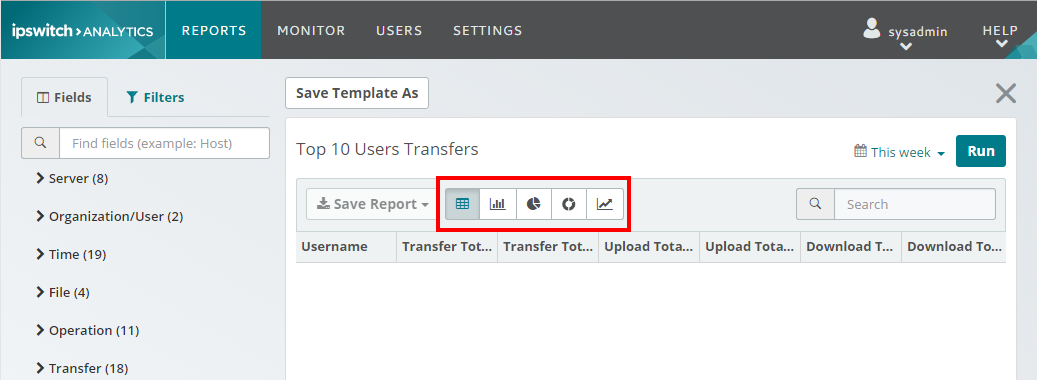
You can include data visualizations as part of a template. When you use the template as the basis for a report, the charts that you defined in the template are included in the report.
You can define one of each chart type in a template: bar chart, pie chart, donut chart, line chart.
Chart icons - location

Chart icons
Icon |
Description |
|---|---|
|
Grid. Does not represent a chart, but provides a convenient way to view the fields that are included in the template. Click this icon, then click Run. |
|
Bar chart |
|
Pie chart |
|
Donut chart |
|
Line chart To produce a line chart, the template must contain a minimum of one numeric field and one date-related field. |
To add a chart to a new or existing template:
The properties page for the template opens.
The chart is populated with data.
Saving a report that contains charts
After you define each chart, its timeframe, and click Run, you can save the report. Data in the report, including data represented in the charts, cannot be changed.
Using a template in a schedule
If you save a template that contains charts, and set up a schedule that uses the template, reports that are generated when the schedule runs contain those charts, populated with data from the schedule run.
Charts that you do not configure in the template are not available in reports generated from that template.