![]()
![]()
![]()
![]()
|
|
|
|
|
This topic describes how to run a template to create a report on demand. You can also schedule a report for delivery at a future time.
The Template Editor opens, showing the template.
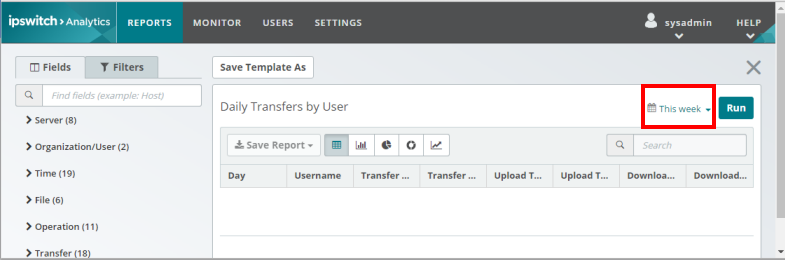
When run, the report will include only events that fall within the time range you select. The default is This Week.
Note: You cannot save a time range with a template. The time range selector affects only templates that you run in the Template Editor.
Warning: Long time ranges might take longer to process. To reduce the amount of time it takes to run a template, make the time range shorter.
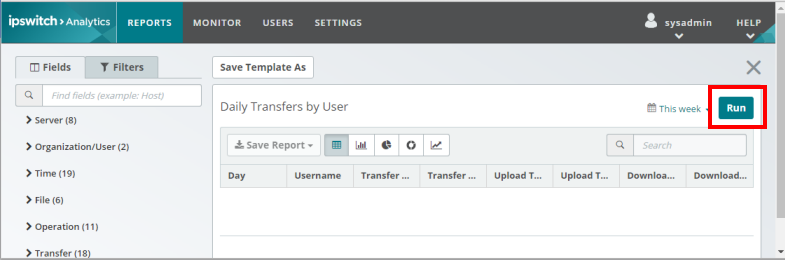
Click the button for the chart type (line, bar, donut, pie) and make your selections. For more information, see Add Data Visualizations.
After a few moments, the report opens. It contains data records for the fields and filters specified by the template. The time range is listed beneath the template title:
Click any column heading in the report to sort data in ascending or descending order (arrows indicate sort direction).
After the template is populated with data, it becomes a report that you can save to the Library, or export and download as a PDF or CSV file. Click Save report and make a selection..
Note: Saved reports do not contain column sorting.
After the report is run, you can use the Search box to locate any item in the report results. The asterisk (*) wildcard is accepted in searches.
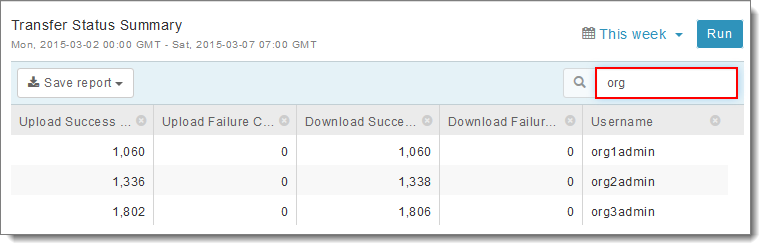
Note: Searches cannot be performed inside of packages/files transferred.
Note: When searching for a time, enter 16.30 instead of 16:30.
Click a column heading to sort data in ascending or descending order (an up or down arrow indicates sort direction). Column sorting is available only in the Template Editor; sort order cannot be saved with the report.
Tip: To save a report with a specific column sort order, save the report to CSV and then use the column sorting feature in Excel or similar tool.
Tip: If a template takes a long time to run, click Close if necessary to close the Template Editor (you will lose any unsaved template changes).
Tip: To view multiple reports at the same time, open Ipswitch Analytics in additional web browser tabs or windows.
The saved report includes all of the report's fields, field placement, filters, and time range. Reports that display in the Template Editor are limited to 1000 rows, but saved CSV reports will include all possible row results.
Note: If you searched for a value within the report, then go to save the report, the saved report will include ALL report results, not just the rows that met your search criteria.
Tip: A saved report does not include any data reported after the template was run. To save the most up-to-the-minute data, re-run the template right before saving the report.
Enter a Report name and Description.
Use the suggested name, or enter a new name.
Note: A saved report does not indicate Filter and time range settings. We recommend that you include Filter and time range information in the report name.
Click Save.
It may take a few moments for the report to complete the save/download process. Your browser will notify you when the download is complete.
If you saved the report to the Library, the Library report will be viewable only by you initially. To allow other users and user groups to see the Library report, see Control Access to a Library Report.
If you saved the report as a PDF or CSV file, your browser will download the file. You can then print the report or attach it to an email.
Important: You may need to reformat some of the columns to display all content in a CSV file, such as any Field that contains a comma (for example, content in a Status Message Field), and the Timestamp Field. To reformat an Excel column, first select the cell or column, right-click and then select Format Cells. On the Number tab, select Text if the Field contains a comma, or Date to reformat the Timestamp Field.