About the Device Status dashboard
Device Status dashboard
The Device Status dashboard is used to view information about a specific device. You can only add single device dashboard reports to the Device Status dashboard.

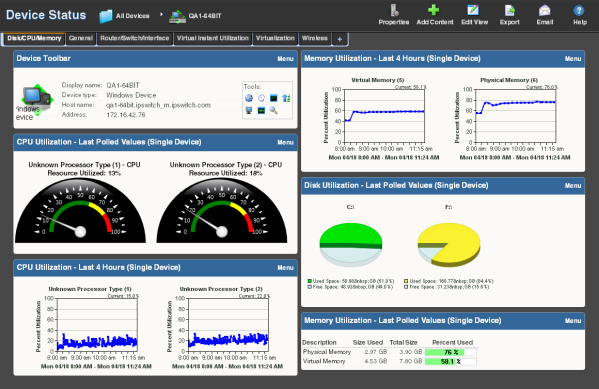
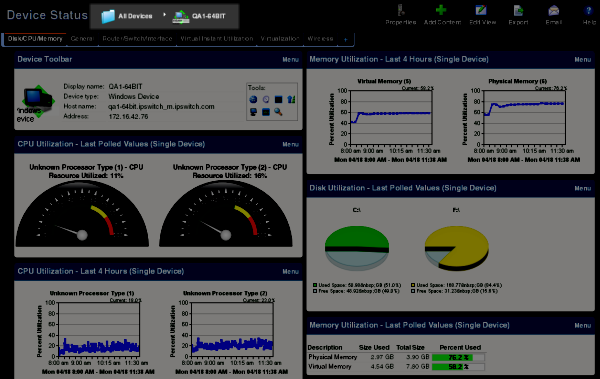
The Device Status dashboard presents relevant information about the health and performance of a single monitored device. Throughout the web interface you see links to devices, such as ![]() . All of these links point to the Device Status dashboard for that device. If there is a potential problem with a monitored device, the Device Status dashboard is a good place to look for more information on the device status. The Device Status dashboard includes several default dashboard views:
. All of these links point to the Device Status dashboard for that device. If there is a potential problem with a monitored device, the Device Status dashboard is a good place to look for more information on the device status. The Device Status dashboard includes several default dashboard views:
- Disk/CPU/Memory
- General
- Router/Switch/Interface
- Virtual Current Utilization
- Virtualization
- Wireless

There are many different types of devices and a variety of features and services that can be monitored. The dashboard views let you select a view that is most appropriate for the individual device. Each time the report is visited, the last view selected for a device displays.
The Disk/CPU/Memory View is the most appropriate view for a Windows or UNIX host that supports the Host Resources MIB for performance monitoring. The Router/Switch/Interface View is the most appropriate view for a manageable Switch or Router that is capable of reporting Interface or Bandwidth utilization.
The device name and icon display at the top of the Device Status report. To change the focus of the report to another device without leaving the report, select a new device from the device context in the dashboard title bar.

For more information, see Adding dashboard reports to a dashboard.