Device Status
Device Status dashboard ( menu []) provides a complete system summary and performance survey for a single device.
- Click
 to add a new tab (an empty or preconfigured dashboard "view") to the Device Status dashboard.
 - Click
 to access a menu of actions applicable to the current view.
: See Working with Dashboards in WhatsUp Gold to learn about WhatsUp Gold dashboarding capabilities and customization.
Device Status dashboard includes the following individual dashboard views:
 Monitoring. Monitor status, summary, and logs.
Monitoring view of the Device Status dashboard includes:
- Ping Response Time. ICMP packet ("ping") round trip times.
- State Change Timeline. Record of when a monitor on a device changed from one state to another during a selected time period
- Action Activity Log. The most recent actions recorded for the activity log.
- Down Active Monitors. Active monitors reporting a down state.
- Device Active Monitor States. Active monitor health for the current device (at a glance)
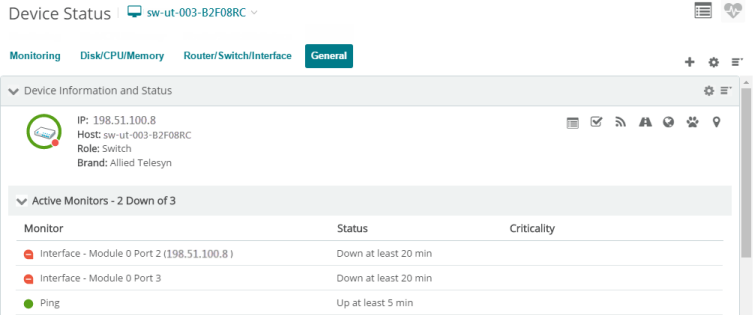
- General. Custom and polled system information and links.
General view of the Device Status dashboard includes:
- Device Attributes. Table of attribute values, labels, and descriptions that characterize a single device.
- Device Notes. Notes field associated with the current device.
- Device Custom Links. Add frequently used or critical hyperlinks by device to dashboard.
- Disk/CPU/Memory. Performance, capacity utilization, and availability.
Disk/CPU/Memory view of the Device Status dashboard includes:
- Router/Switch/Interface. Network capacity utilization.
- Interface Utilization. Network traffic across one or more network interfaces for each device or device group you specify.