Azure Cloud (Performance)

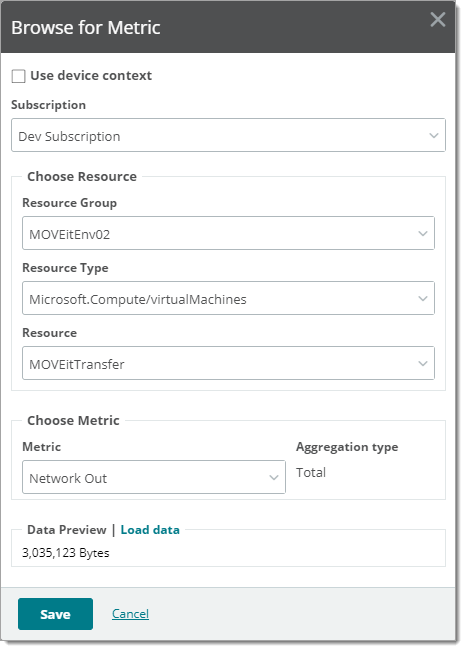
The Azure Cloud Performance Monitor allows you to select, poll, and record Microsoft Azure performance data. Cloud monitors enable you to integrate WhatsUp Gold with the cloud vendor's management service and track your subscription services and resources from WhatsUp Gold like traditional WhatsUp Gold device roles.

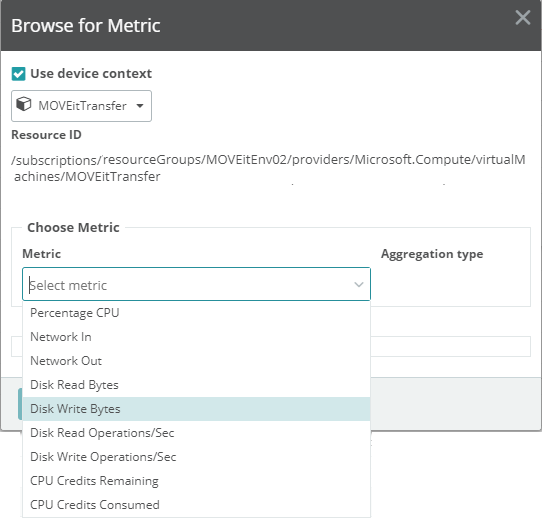
Tip: You can select the cloud resource you want to monitor at configuration time using the Create Azure Cloud Monitor dialog. For example, if you add an Azure blob storage or table service to your cloud subscription and want to add a new monitor, you can create and apply a new monitor directly —no new discovery scan is needed.

  1. Configure the following fields to set up your Azure Cloud Performance Monitor:
    • Name. Enter a unique name for the monitor. This name displays in the Performance Monitor Library.
    • Description. Enter additional information for the monitor. This description displays next to the monitor name in the Performance Monitor Library.
  2. Click Edit —select an Azure credential from the list, then click OK.

  3. Browse for Azure resources associated with this credential and select them for monitoring. Browse for resources in either of two modes:
    • Device Context. A device (VMs, for example) managed by the Azure subscription associated with the current credential. (show me)
    • Subscription. Any resource groups that you granted access to when you created your API Key, and scope down: (show me)
      • Resource Group
      • Resource Type
      • Resource
  4. Select a Metric. And click Load data to preview current data with the given Aggregation Type (Average, Total, ...)
  5. Click Save to return to the performance monitor configuration dialog.
  6. View the summary, and click Save to add the monitor.

Edit Polling Interval

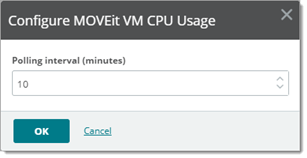
After you configure and apply a Azure Cloud (Performance) monitor to a device, you can edit the Polling Interval applied to a specific device from Device Properties (Properties).

See Also

Performance Monitors

Active Script (Performance)

APC UPS (Performance)

AWS CloudWatch (Performance)

Azure Cloud (Billing and Usage)

CPU Utilization (Performance)

PowerShell Scripting

Disk Utilization (Performance)

Printer Ink/Toner Performance Monitor

Hyper-V Virtual Machine Disk Activity

JMX (Performance)

Interface Utilization

Memory Utilization (Performance)

Ping Latency and Availability

REST API (Performance)

SNMP (Performance)

SNMP (Performance)

SQL Query (Performance)

SSH (Performance)

VMware Datastore IOPS

Windows Performance Counter

Configuring WMI Formatted Counter monitors

WMI Performance Monitor

Hyper-V Event Log Monitor

Hyper-V Host Virtual Machines Monitor