SNMP Trap Log
The SNMP Trap Log provides a history of SNMP traps that have occurred for all devices in the selected group during a time period. If the SNMP Trap Listener is configured to listen for messages, any messages received are recorded in the SNMP Trap Log.
- To add an SNMP monitor for a specific device, select the device from the Devices list and select Properties > Passive Monitors > SNMP Trap.
- To accept SNMP messages from any device, access the console and select Program Options > Passive Monitor Listeners > SNMP Trap. Select Configure and choose Accept unsolicited SNMP traps.
Note: In order for entries to be added to this log, the SNMP Trap Listener must be enabled. For more information, see Enabling the SNMP Trap Listener. Additionally, if the trap receiving port is not on the list of firewall exceptions, traps may not be receivable and as a result will not be added to the SNMP Trap Log. Please ensure that the trap receiving port is on the firewall exceptions list.
Tip: If you experience page load delays for device or system passive monitor logs (SNMP Trap, Syslog, and Windows Event Log), this may be caused by too many records displaying for the selected time range. Change the time range or reduce the Maximum Passive Monitor Records setting to display fewer records. Reducing the maximum number of passive monitor records will improve WhatsUp Gold report and log display performance. For more information, see Managing server options.
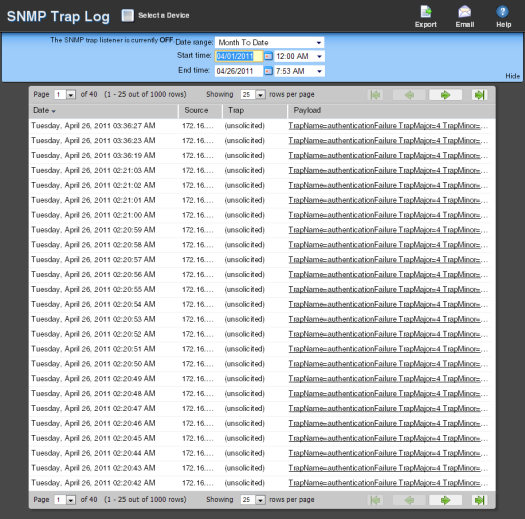
This log includes the time the message was received as well as its source, the trap that triggered it, and its payload.
Log body
The following information is displayed in the log:
- Date. The date the trap occurred.
- Source. The device or program that originated the trap.
- Trap. The type of trap received.
- Payload. The vital data (such as trap name, the IP address from which the trap came, date of the trap, etc.) that passed within a packet or other transmission unit.
Tip: Move your mouse over the payload entry to view more of the payload information.
Note: The data is limited to the first 100 bytes in the payload. To view the full payload, click the payload entry to view the payload details.
Note: If the log data exceeds the maximum number of records set for full reports, use the Paging Options to view more records for the log. The maximum number of records any full report displays is specified in the Preferences dialog.