Device Management![]() Device Properties
Device Properties![]() Device Merge Decision Information
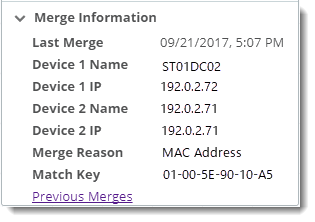
Device Merge Decision Information
Device Management![]() Device Properties
Device Properties![]() Device Merge Decision Information
Device Merge Decision Information
WhatsUp Gold uses discovery-time rule sets in order to understand device boundaries. Properties that identify a device as a distinct entity include MAC address, network address, SNMP System Name, and NetBIOS characteristics. As Discovery harvests device information, these device-distinguishing characteristics help WhatsUp Gold to recognize and merge device records belonging to a single physical or virtual device.
Note: For special environments, you can provide hints to WhatsUp Gold to override normal device record merging using Address Exceptions.
You can view device record merge activity as a:
 Inventory tab, and from the drop down list, choose Merge.
Monitors. Browse, apply, and configure passive, active, and performance monitors to this device.
Note: The grid on the Monitors tab is filtered by default to only show monitors assigned to the device that are currently enabled. To display all assigned monitors, hover your cursor over the Enabled column header, click the drop-down arrow that appears, then clear the applied filter from the options displayed.
Tip: You now have the ability to specify the protocol by which WhatsUp Gold collects CPU, Disk, Memory, and Interface utilization data from the device. From the Monitors tab, select the applicable monitor, click ![]() , then select the desired protocol for collecting performance data at the top of the configuration dialog.
, then select the desired protocol for collecting performance data at the top of the configuration dialog.
Tip: In WhatsUp Gold, a given device is considered to be in a down state if it has either a critical monitor down or all monitors down.
Polling. Adjust polling interval, target address, and dependency chain.
Tip: If you need to apply a shorter poller interval either temporarily, or for troubleshooting performance, consider using the RealTime Performance monitor.
Note: In WhatsUp Gold, a given device is considered to be in a down state if it has either a critical monitor down or all monitors down
Actions. Send notifications, log events, chain together corrective actions and apply escalation rules.
When you apply active monitors, you typically associate an action and a device state with changes observed by the monitor. There are three main categories of built-in action types available through the Actions Library. Actions can be triggered or scheduled.
Note: Certain actions (CM Actions, for example) can be invoked on demand (Run Now).
Built-in action types include:
Credentials. View and associate built-in credential types with this device. (Needed for rich discovery and monitoring information.)
Credentials Library provides the following credential types:
Network Management. Simple Network Management Protocol (SNMPv1, SNMPv2, SNMPv3).
Credential Type |
Description |
Typical Use |
Administrative SNMP domains (for example, networks and subnets) are defined by a shared SNMP community string. |
Poll with WhatsUp Gold performance monitors with access to MIBs on any device running an SNMP agent with a default ("public") or otherwise configured community string. |
|
User based security with SNMP message authentication for data integrity and origin authentication. |
Poll with WhatsUp Gold Performance monitors for SNMP-enabled devices using SNMPv1,v2,v3.
|
System Attributes and Instrumentation. Windows, VMware, SSH (typically used for Linux and UNIX).
Credential Type |
Description |
Typical Use |
Windows user credentials. It is best practice to scope these according to the principal of least privilege. |
|
|
Remote commands, scripts, and management. |
|
|
Telnet (UNIX, Linux) |
Remote commands, scripts, and management. |
|
VM platform attributes, status, and logs. |
|
Remote Execution. Secure Shell client (SSH), Telnet client.
Credential Type |
Description |
Typical Use |
Remote commands, scripts, and management. |
|
|
Remote commands, scripts, and management. |
|
Storage Device Management. Storage Management Initiative Specification (SMI-S).
Cloud. Amazon Web Services (AWS), Azure.
Tip: Most active monitors that include scripting (PowerShell, for example) have the ability to apply credential sets as part of remote processing (before and during the active session).
About Credentials.
Tips for Applying Credentials.
Tip:: Most active monitors that include scripting (PowerShell, for example) have the ability to apply credential sets as part of remote processing (before and during the active session).
Attributes. User-defined, role-defined, and other properties uncovered during discovery that describe the device.
Attributes panel enables you to view device system and host descriptions, modify some of this information, and populate user defined attributes (such as Contact Information).
Tip: Attribute values can be auto populated using Device Role definitions. You can also customize Device Attributes using discovery percent variable syntax.
Roles. Browse, apply, and template the model applied to this device for discovery, role determination, and default monitor scheme.
Primary Role. Consider these roles as candidates for the current role definition during discovery/rescan.
Select a generalized role class to apply.
Your role will inherit default characteristics from this class such as discovery attributes and default monitors that you can modify if appropriate.
Sub Roles. Add sub roles to consider for discovery/rescan.
Select a generalized sub role to apply (given your Scan Rules).
About Device Roles
Tip: You can customize roles and subroles using the Roles/Subroles Editor.
Inventory. (Information only) Tables of system-specific, host, OS, chassis and layer 2 connectivity and merge data reported by the selected device when discovered/rescanned.
Inventory provides complete views of the device management information.
Links. User-defined or role-associated URLs associated with the selected device.
Define a custom link and apply it to the discovered device. You can customize for each device using discovery percent variable syntax.
Note: Custom Links can be tabulated and distributed as Custom Link reports.
Add link for viewing web role or web service running on current device.
http://%Discovery.Device.Name.example.com:80
Add link to manage vCenter using vSphere web client.
https://%Discovery.Device.Name.example.com:9443/vsphere-client
Applications. View and manage application instances WhatsUp Gold is monitoring on the selected device.
Application Monitoring (SETTINGS menu > Application Monitoring > Application and Profile Setup) (also referred to as "APM") gathers performance statistics and overall application health while alerting on performance degradation and potential problems before they result in service outages. APM can assist organizations to measure service level and guarantee Service Level Agreements (SLAs) as well as assist in pinpointing application performance bottlenecks and points of failure. APM allows you to monitor the performance of "applications" and application-layer services running on your monitored devices.
This section outlines the essential building blocks you use to build your full APM solution.
WhatsUp Gold and its supporting reference content use the following terminology when discussing application monitoring:
Preparing to Discover. Select profiles you want applied during discovery or add new ones.
Configuring WhatsUp Gold to monitor an application is a simple process. It starts with selecting a profile that captures data points necessary to understand the performance, health, and status of a given type of application. The application profile groups the components, discrete applications, and associated thresholds necessary to capture the data points into a blueprint that can be used to create individual application instances. These instances actively monitor your applications. Ipswitch provides a selection of profiles which are available upon successful WhatsUp Gold installation. You can also create your own application profiles. After you have the necessary profiles, you can automatically discover your applications and create instances for each discovered application, or you may choose to manually create and modify instances individually before you begin monitoring.
Discovering Applications. Discover devices with resident applications that match selected application profiles.
You can discover applications on and create application instances for devices monitored by WhatsUp Gold. To be discoverable, an application must have at least one discoverable service or process component associated with its profile. Ensure Use in discovery is enabled when adding or editing Windows service or process components within the application profile.
To discover applications:
After applications are discovered, use the list of newly discovered applications to select which ones to monitor and subsequently create application instances.
To monitor newly-discovered applications:
You manage application instances by way of the Application and Profile Setup view (SETTINGS menu > Application Monitoring > Application and Profile Setup).
Analyze log, reporting, and dashboard data to assess performance, quality of service, and impact.
Application monitoring data can be visualized, shared, and reused using Export Data (![]() ) and Dashboard Options (
) and Dashboard Options (![]() ).
).
Tasks. Manage and run scheduled Configuration Management tasks as well as modify and compare archived configuration records assigned to the selected device.
Tasks enable you to apply controls, perform maintenance, and simulate user behavior, based on your site policies and goals.
Typical Tasks
Tip: For more details on how to build Scheduled Tasks and Password Tasks, see the section titled Configuration Management.
Merge information includes: